
Iced Raktajino
I’m beautiful and tough like a diamond…or beef jerky in a ball gown.
- 43 Posts
- 249 Comments


 3·10 days ago
A few years ago I decided to try the lithium-ion UPSs. I’m on my 3rd year with them, and I will never go back to lead acid. I’ve got one “classic” UPS that is still in good shape as long as you don’t try to run more than 100w from it, but when it goes, it goes.
These use the LiFePO4 batteries, and I get close to twice the runtime as my old ones, and they don’t drop from 80% to 10% like lead acids do. The battery chemistry is also good for about 10 years of daily cycling, so assuming the electronics hold out, they seem like they’ll last.
The only hiccup with the model I got is it doesn’t have a serial monitor connection, but you can probably fine plenty that have it.
 4·14 days ago
Mine’s a nice stovetop kettle but it’s on an induction hot plate near my coffee maker. Works pretty similar to electric kettles that have the detachable bases, but I can use it on the stove if I want or use the hot plate for other things. The temperature controls on the hot plate also work really well for heating water to just under a boil.
I bought the induction hot plate to use when the power went out since I didn’t have 220v to run my stovetop, so this is how I make use of it so it’s not sitting on a shelf until the power goes out lol.
I also keep my grounds in a Mason jar.
Usually I go for ease of ingesting caffeine as quickly as possible and use a generic single-cup coffee maker.
- Fill the reusable k-cup with grounds and put it into the coffee maker
- Fill the coffee cup with water and pour into the tank
- Place cup and press the power button
- Take the dogs outside while it’s running
- Add a splash of sweetener and/or vanilla syrup
- Enjoy
Obviously, I’m not fancy about it at all. When I do get fancy, I’ll use the French press. Sometimes I’ll cold brew in the French press overnight but I always forget so that’s a rare treat when I do remember.
74 inches it seems (just tested haha)
Ugh, yeah. My “temporary” spinners that were an emergency upgrade became permanent when I went to buy the new ones and prices had skyrocketed. I’ve got one cold spare left, so hopefully there’s a price break in the near-ish future
I feel that.
Before I downsized, I was running 3x HP DL360 G6’s with dual Xenons and 96 GB RAM each. Way overkill for my needs but I got them cheap. Unfortunately, they and my air conditioner competed to see who could use the most electricity each month. 😆
The only thing I really lost in the scale down was the ability to spin up dev/test VMs for every little purpose. I’ve mostly just started using Docker containers for things like build environments.
Their Intel graphics work great for transcoding, but yeah, not much else. I’ve got Emby one one of them, and the QuickSync hardware acceleration works well even with multiple simultaneous streams.
Works pretty great as long as you keep your expectations realistic. Easy to upgrade and pretty reliable. Only annoying thing with any of those micro PCs is the cable management is a pain because of the power bricks. I got some USB-C PD adapters and Dell-style cables and that’s made a huge improvement.
About 220W on average with peaks around 280W. I’ve got 8 Optiplex micro PCs, 5 upcycled thin clients running smaller services, fiber ONT, another micro Optiplex as a router, a storage server, main switch, and a 5 port PoE switch for my 4 access points around the house.
Before I downsized everything to the USFF PCs, I was running 3 old enterprise rack servers that were about 220W each.
It’s currently running from solar from about 7am to 4pm with my small solar setup, but I’m in the process of installing a whole house PV system so hopefully will be 24/7 solar powered soon-ish.
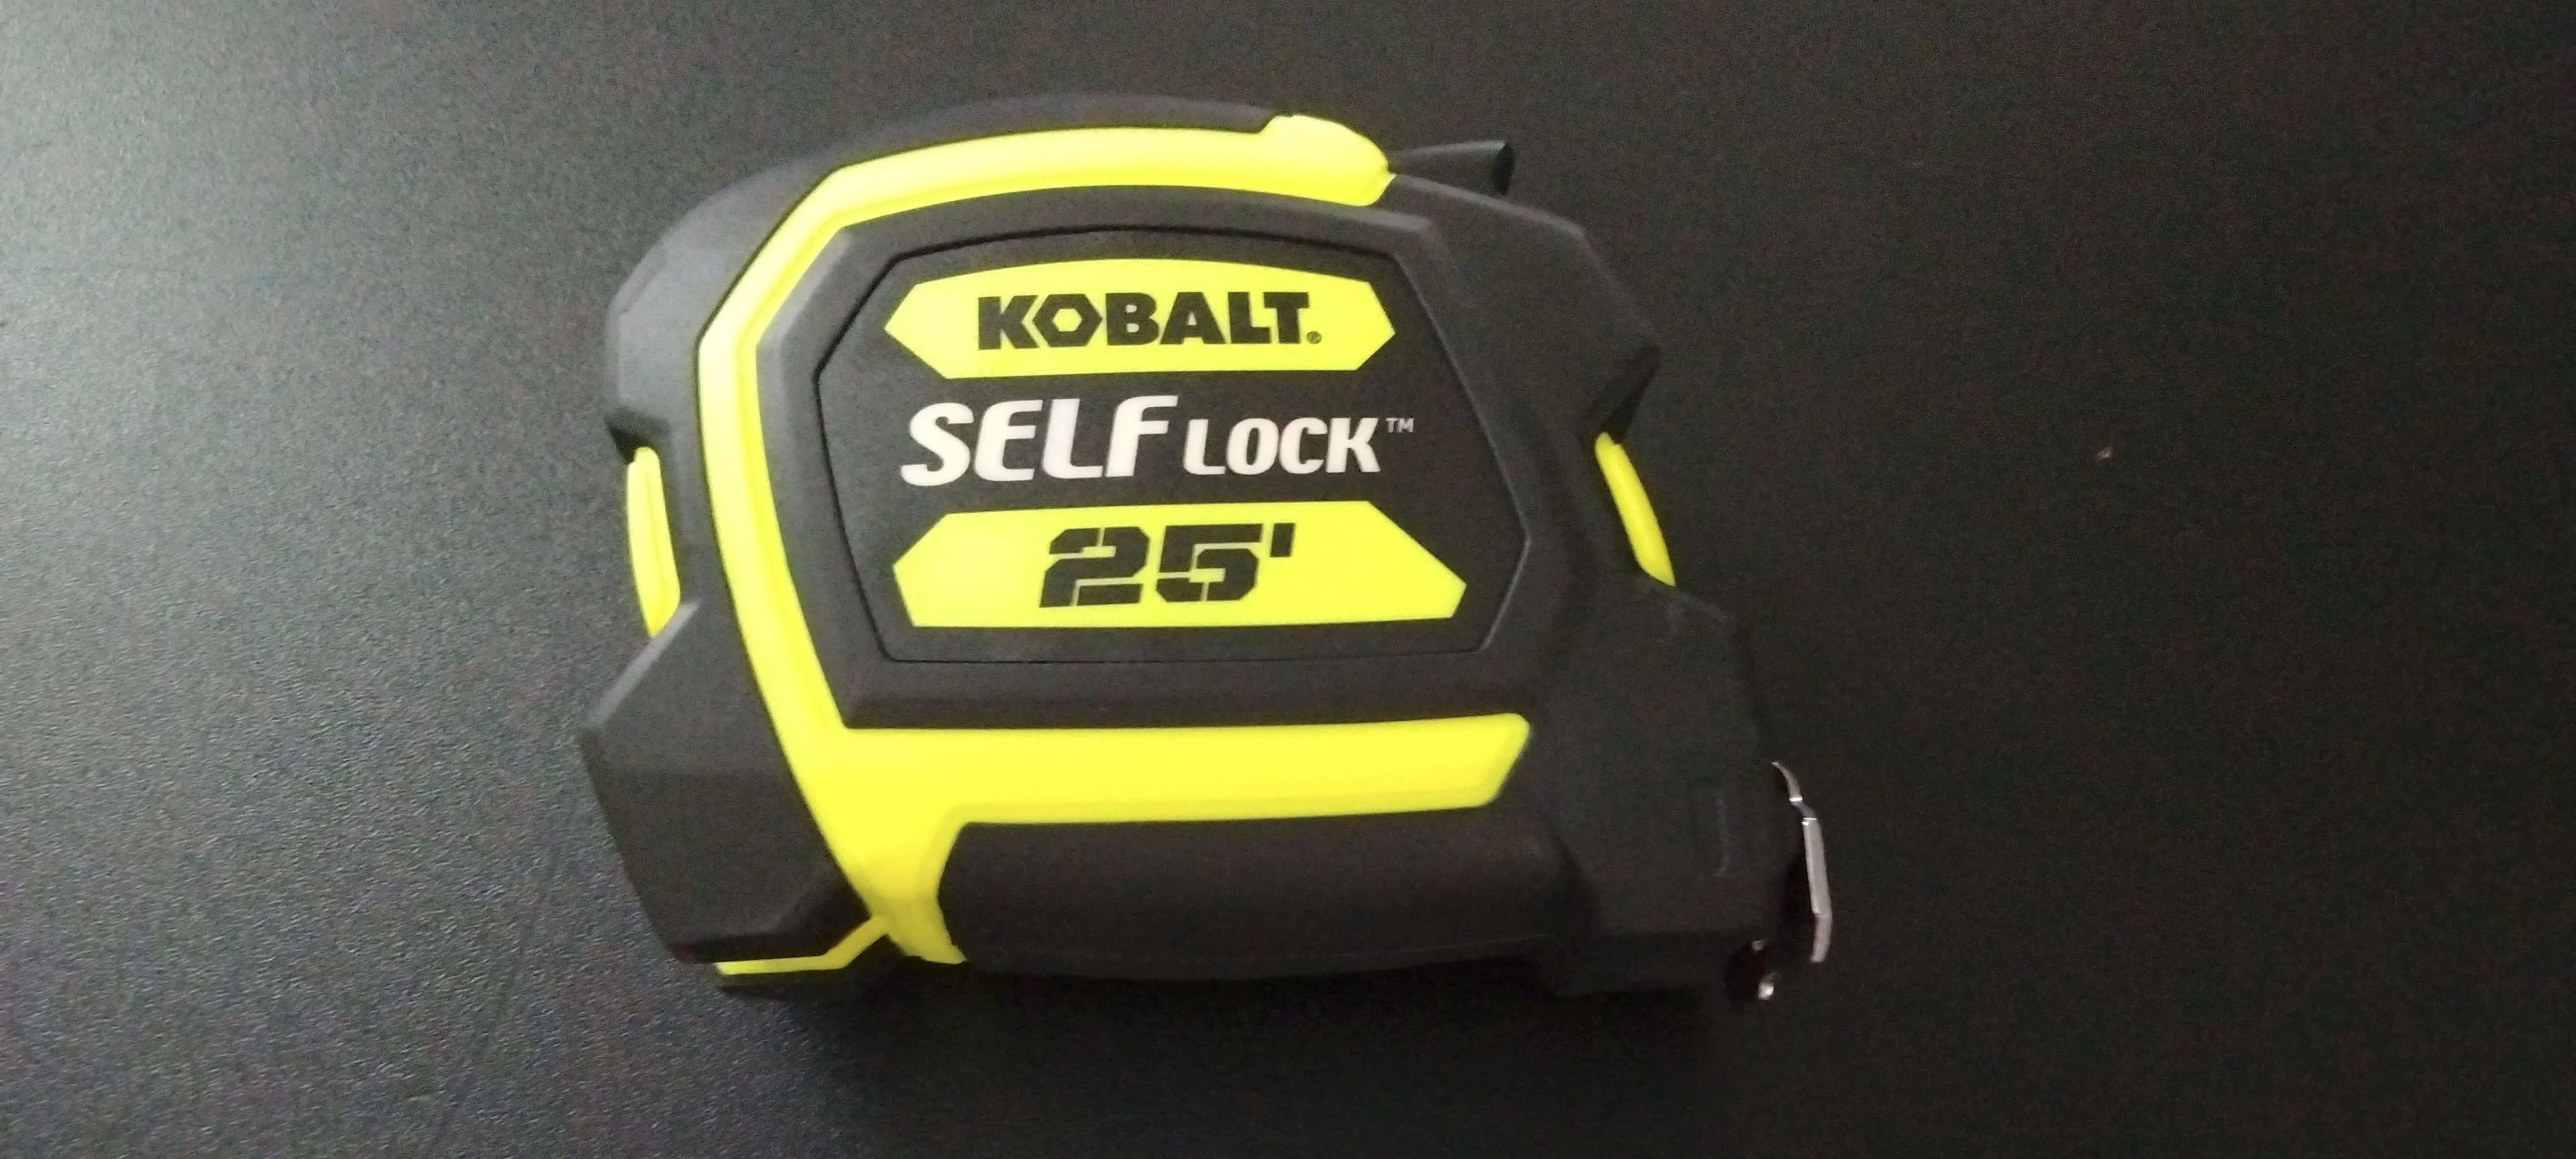
Kobalt pretty much mainly has blue livery here, too. I thought it was a Stanley when I first spotted it, so I guess they’re diversifying.
Everyone likes to crap on Harbor Freight tools, but for casual work they last me at least 8-10 years in most cases. Considering they cost 1/3 or 1/2 the price of bigger brands, I’m fine with that. It’s not like any tool you can by these days, especially power tools, are heirloom quality like the tools our dads or grandpas used.
This one seems to hold its place pretty well, but there’s also a lock switch if you need it to really stay put.
I’ve been told that government auctions canbe a good source for cheap used PCs
Can confirm government surplus auctions or sales are a great source for cheap PCs and that they do get snatched up quickly (guilty!) The only other catch is they never come with hard or solid state drives. I’m assuming those just get pulled and destroyed.
Thanks, and yeah, it’s been fun putting that all together. Unfortunately I’m still learning FreeCAD so they’re not as integrated as I’d like yet, but as soon as I have time to hammer out a design, I hope to have all 3 of these and the UPS/power supply in a nice case.
Yep, running/charging it from solar is why I ended up getting that chonky 18650-based UPS board. It’s the only one I could find that could combine 5V input and battery without dropping out (battery kicks in immediately if solar insufficient and draws the difference between input and output and charges and powers simultaneously otherwise).
Thanks!
What are the use cases for taking it with you instead of just connecting to your homelab?
I built it just to see how much I could cram onto a Pi Zero clone/how many self-hosted services I could have on something I can fit on my keychain, and the answer was “a lot”. It’s something of a travel server, travel router, emergency backup server, etc.
I mainly just wanted a subset of my homelab services available in something I could take with me anywhere. Home lab could go down while away, power could go out, something to use while glamping, can take it with me if there’s ever an emergency where I have to evacuate, etc.
What started out as a single unit has become a three unit portable stack lol. Yay feature creep!
Services
- Jellyfin (all content pre-transcoded so everything can direct stream)
- CodeServer (setup for Python, NodeJS/Bun + React, and Platform.IO for ESP8266/ESP32 development)
- Kiwix (including the full Wikipedia dump with images as well as offline docs for lots of code libraries I work with, etc)
- SearxNG so I always have a sane search engine available
- CalibreWeb with my whole ebook library
- MPD+Snapcast+My whole music library. Also has myMPD web UI for controlling MPD. Snapcast clients can connect, and it can serve multi-speaker/multi-room audio
- PiHole serving both ad blocking and local DNS as well as providing DHCP for the access point
- PairDrop for sending/receiving files
- NodeRED and Mosquitto MQTT for setting up ad-hoc automations
- Nginx with real LetsEncrypt certs so all services have valid SSL certs and hostnames
Networking
- One USB port is configured in ethernet gadget mode. Can plug it into a host PC and get an IP address from it
- One wifi adapter is setup as an AP and is bridged with the USB ethernet (a PC plugged in and a wifi client are on the same L2 plane).
- The second wifi is the “WAN” connection if one is available. Can alternatively connect to USB tethering on my phone
- If there is any kind of “WAN” upstream, the LAN bridge (USB ethernet/Wifi) will route to it
- Wireguard to connect back to my homelab.
File Services
- Samba
- Encrypted LUKS volume for critical docs (tax records, vet records for the dogs, etc)
I’ve got a second unit that connects as a client to the main one with some additional backup services:
- Email stack( Dovecot, Postfix, SpamAssassin, ClamAV, Webmail)
- Matrix/Synapse stack
- Asterisk
- Snapcast client
The second one is basically a backup to my main stack in case of disaster/power outage/etc. Those all tunnel to a cloud VPS + load balancer and only need an internet connection to setup the tunnels to receive traffic from the VPS (and route back out to it). Those services are stopped and a cron task keeps them in sync with the main ones in my homelab. If I need to fail over, I just SSH into the VPS and re-route traffic to them instead of my homelab endpoints.
I self-host my own email and chat and phone services, so those have become critical services I want to always have online. Essentially these little Pi clones are a backup stack for my most used services and one that is both extremely low power and portable should I ever need to host them on the go (house burns down, have to evacuate due to emergency, etc).
Third Unit (Still on the bench)
I have a third unit that’s built on a PiZero2W but it’s still on the workbench (but functional!). Just haven’t gotten any kind of case at all built for it.
It’s got two RTL-SDR units attached. One is tuned to the NOAA weather radio station and feeds into Snapserver on the main unit (so you can listen to the weather radio anywhere on the network) as well as piped into Meshtastic EAS-SANE alerter in order to forward emergency alerts to Meshtastic. There’s a USB-connected Meshtastic node attached as well for that.
The second RTL-SDR is setup as a generic FM radio tuned to the local variety station. It’s just piped to Snapserver on the main unit to make it available on the network.
I may convert the second SDR into a ADS-B listener, but for now, I like having the FM radio available.
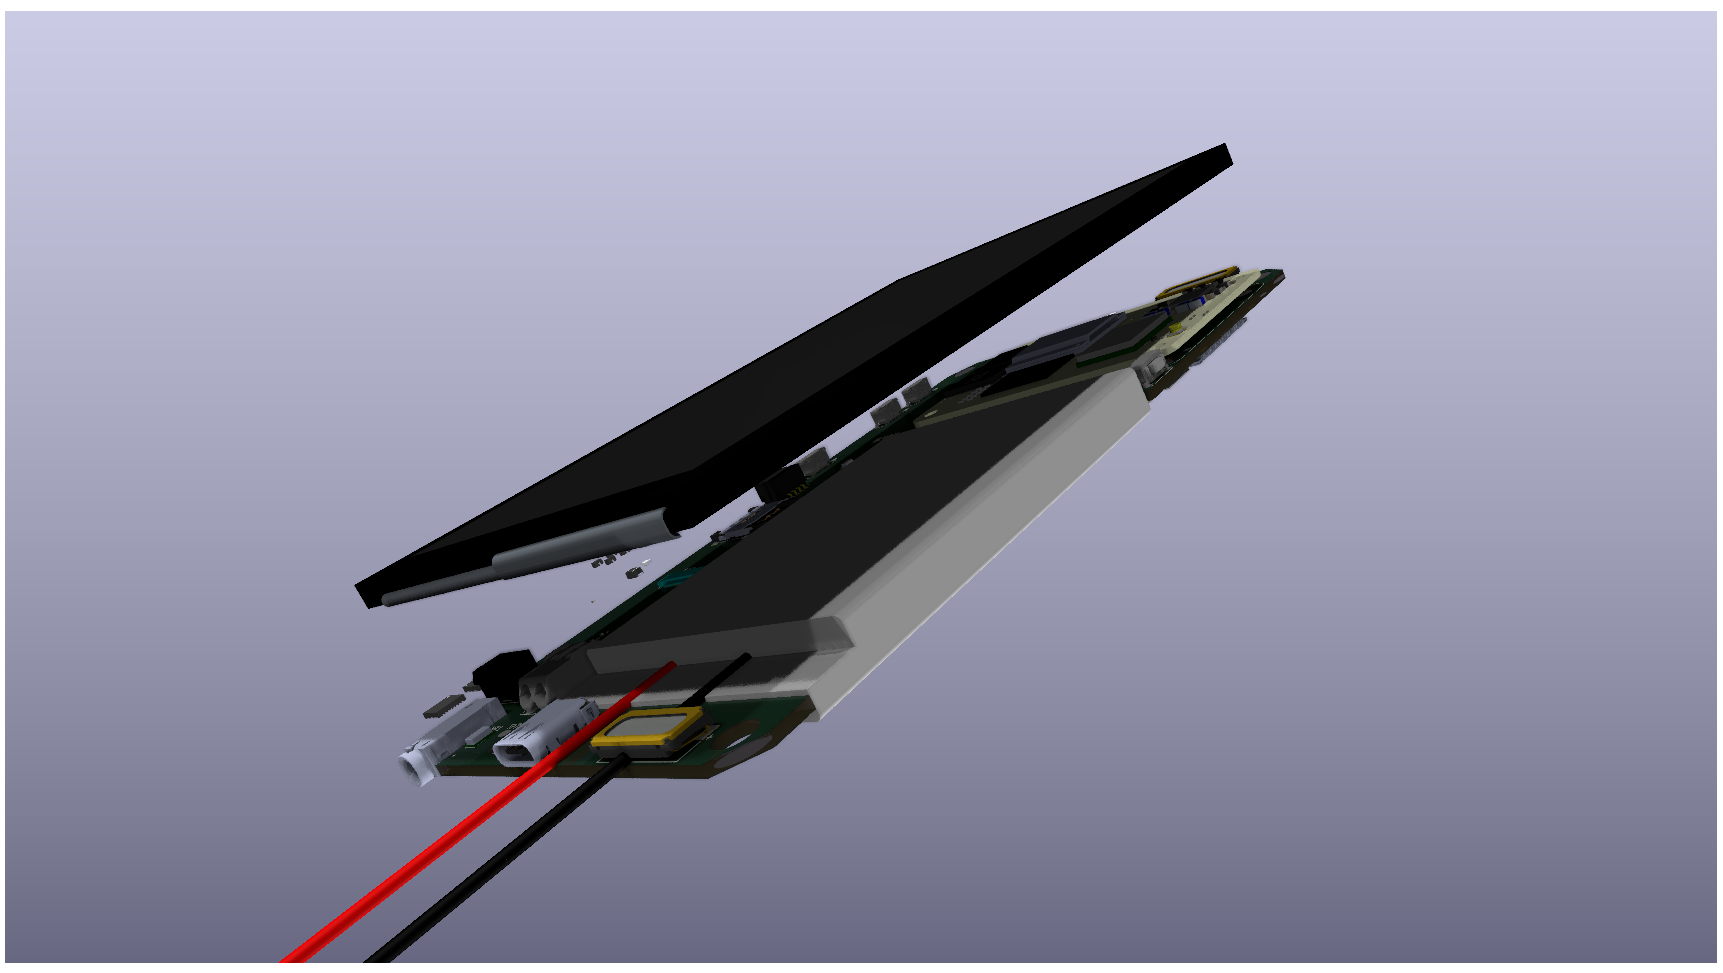
Photo
I still don’t have a “full” case for it, but here is the core unit attached to a UPS circuit which gives it up to about 14 hours of runtime. I’m also planning to add a small USB hub with ethernet into that, but I’m still learning FreeCAD so I’m not quite ready to put it all together yet. The USB power cord is wrapped in aluminum foil and electrical tape due to RF from the Wifi adapter causing random glitches. I need to add some ferrite beads and route them away from that when I build it into an integrated case. For now it looks janky but works lol.
Main Unit:

Secondary Unit: This is an older photo and is also connected to my Bose radio acting as a Snapcast client to the server on the main unit.

I run Jellyfin on a Banana Pi M4 Zero. It’s a little less capable than the Pi4 but runs JF just fine. Specs on this one are quad core 1.5 GHz, 4 GB RAM, 32 GB eMMC on Armbian.
The media files are all on the 1 TB SD card while the Jellyfin data directory (especially the SQLite DB) are on the eMMC. This seems to work much better as the DB file kept getting corrupted on SD. Should also help the SD card from wearing out since it’s pretty much only reading data from it most of the time.
As you guessed, transcoding is not going to work (JF is removing the v4l2 hardware support anyway), so I pre-transcode them to H264 + yuv420p in an mp4 container before moving them to the SD card. I also scale them down to 720p to fit more on there, but that’s because this is a travel server and isn’t my main media source.
Can’t speak for Paperless though.
I had to kill a black snake last weekend, and I still feel bad about it. Usually I leave them be and let them eat the mice and moles but this one was massive and unusually aggressive. It tried to strike at my dog and still don’t know how she didn’t get bitten, but the thing decided to chase her which is what sealed its fate.
I’ve never seen a black snake do that, so I guess it had a nest nearby or something and the dog was sniffing a little to close to it.
 18·26 days ago
AI mixed with news sourced from X. What could possibly go wrong?
Yeah, hard pass from me.
Mine’s only for people I know personally, so it’s backed by my LDAP server and registration is disabled in Synapse. I use my regular onboarding process to create the new LDAP user and grant access to Synapse.


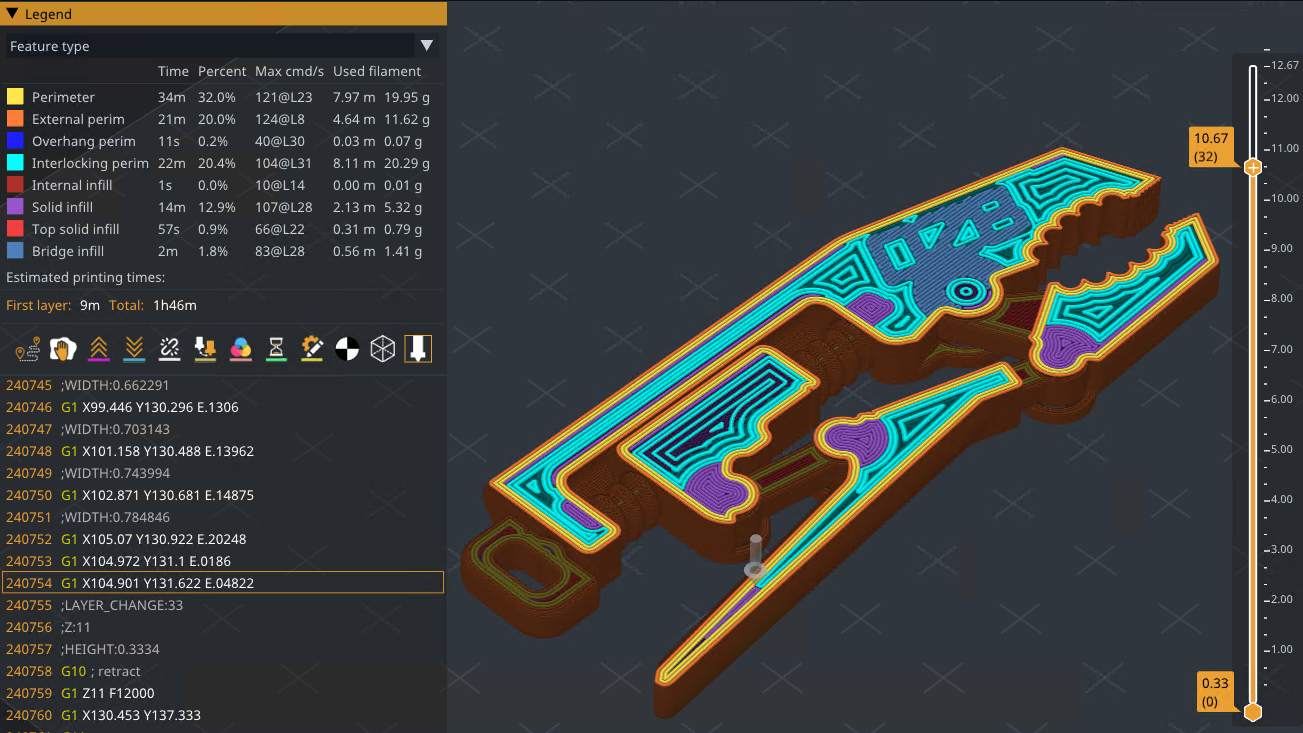
This is approximately where it is in the print. Every time the head moves over any of those support bases, it sounds like nails on a chalkboard 😆